ABSA House Price Indices – SA House price growth showing early signs of nearing a peak
Latest trends in South African house prices
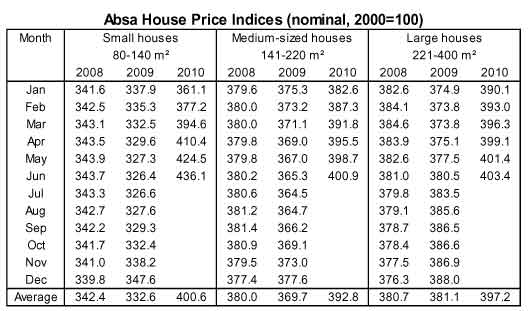
South African home values increased further in June 2010, but there are early indications that year-on-year price growth may peak in the near future. The average nominal value of small, medium and large houses for which Absa approved mortgage finance (see explanatory notes), increased by a weighted 14,8% year-on-year (y/y) in June, which brought the average price of a middle-segment house to about R1 083 700. In May this year nominal home values in the middle segment of the market increased by a revised 14,7% y/y.
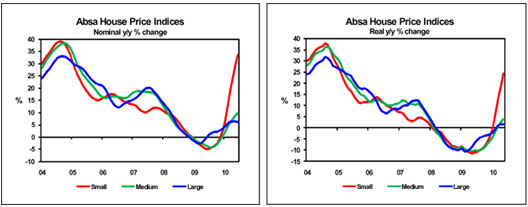
In real terms, i.e. after adjustment for the effect of inflation, the average value of middle-segment homes was up by 9,7% y/y in May (up 8,5% y/y in April), which was influenced by a further slowdown in consumer price inflation to 4,6% y/y from 4,8% y/y in April.
In the category for small houses (80m²-140m²), the average nominal value of homes increased further at a rate of 33,6% y/y in June this year, after rising by a revised 29,7% y/y in May. The average nominal value of small homes came to a level of about R868 600 in June. The average real value was up by 24% y/y in May, after rising by 18,8% y/y in April.
The affordability of housing was to some extent adversely influenced by trends in the growth in house prices and households’ disposable income in the latter half of 2009 and in early 2010. This is believed to have contributed to buyers focusing more on the category for smaller housing in recent times, impacting price trends in this segment of the market.
The average nominal value of medium-sized houses (141m²-220m²) was up by 9,7% y/y in June 2010, after rising by a revised 8,6% y/y in May. The average nominal value of a home in this segment was around R1 million in June. In real terms the average value of a medium-sized house increased by 3,9% y/y in May (up 2,3% y/y in April).
Year-on-year growth in the average value of large houses (221m²-400m²) slowed down to a nominal 6% in June this year, after an annual growth rate of 6,3% was recorded in May. This moderation in price growth in the large category can be ascribed to base effects, with year-on-year price deflation in the large segment slowing down rapidly up to June last year before price growth resumed again in July. The average nominal value of a large house came to R1 469 200 in June his year. In real terms the average value of a home in the large segment was up by 1,6% y/y in May, after rising by 1,5% y/y in April.
Prospects for the rest of 2010
Consumer price inflation is forecast to bottom in the third quarter of 2010, rising again in the final quarter of the year on the back of inflationary pressures. Double-digit administered price inflation and wide-spread wage hikes of well above inflation are regarded as the main risks to the inflation outlook over the short to medium term. Based on these expectations in respect of inflation, interest rates are forecast to remain at current levels in the rest of the year, providing no further stimulus to the residential property market.
Price growth in the South African housing market appears to be nearing an upper turning point, judging from the abovementioned latest trends in annual growth in the large segment, as well as the weighted average year-on-year price growth registered in the three categories of small, medium and large houses, which was marginally higher at 14,8% in June compared with 14,7% May this year.
Against this background, year-on-year house price growth is expected to slow down in the latter half of the year, mainly driven by the base effects of a recovery in property prices in the second half of 2009.


Courtesy: Jacques du Toit Senior Economist ABSA Bank


Explanatory notes:
The Absa House Price Indices, available back to 1966, are based on the total purchase price of houses in the 80m²- 400m² size category, priced at R3,1 million or less in 2008 (including improvements), in respect of which mortgage loan applications were approved by Absa. Prices are smoothed in an attempt to exclude the distorting effect of seasonal factors and outliers in the data. As a result, the most recent index and price growth data may differ materially from previously published figures.
Disclaimer:
The information in this publication is derived from sources which are regarded as accurate and reliable, is of a general nature only, does not constitute advice and may not be applicable to all circumstances. Detailed advice should be obtained in individual cases. No responsibility for any error, omission or loss sustained by any person acting or refraining from acting as a result of this publication is accepted by Absa Group Limited and/or the authors of the material.


