


Key Findings: Results for Q4 2017
BERLIN BUCKS GLOBAL TREND AS URBAN HOUSE PRICE GROWTH SLOWS
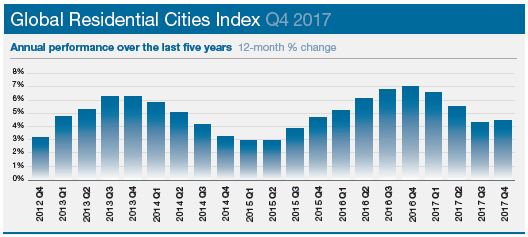
Unique in its assessment of house price performance across 150 of the world’s cities, the latest results of our Global Residential Cities Index confirms the degree to which price growth moderated in 2017 says Kate Everett-Allen.
In 2017 the index averaged growth of 4.5%, a year earlier this figure was closer to 7%.
With fiscal stimulus being withdrawn, capital controls in place in China, and the beginning of a shift towards the normalisation of monetary policy, annual price growth above 20% is now confined to only a few outliers.
At the end of 2016, 12 cities, most of them Chinese, registered price growth above 20%, a year later only one city falls into this category; Berlin.
Germany’s capital leads the rankings with prices ending the year 21% higher. Strong population growth, a stable economy, record low unemployment and robust interest from overseas investors are together propelling prices higher.
As housing markets become more transparent and new official indices are published we review the composition of the index to optimise our city coverage. This quarter marks the inclusion of German cities for the first time.*
The slowdown in Chinese cities in 2017 had a marked influence on the index’s overall performance. In 2016, the 15 Chinese cities tracked by the index averaged 23% growth year-on-year. In 2017, the same 15 cities averaged 1.6% growth. Chongqing is now the frontrunner, with previous hot markets such as Shenzhen and Beijing slipping down the rankings.
Analysis on a country-by-country basis shows Iceland was home to the strongest rising urban house prices and Peru the weakest in 2017.
When looking at the most improved markets in 2017, Seville and Hong Kong lead the way, with annual price growth shifting from -9.9% to 7.4% and from 4.3% to 14.8% respectively over the 12-month period.
Despite four interest rate rises in the last 18 months house prices in US cities are accelerating. Across the 15 US cities tracked, prices rose 6.3% on average in 2017. Seattle and San Francisco are out in front, prices ended the year 12.7% and 9.3% higher respectively.
Vancouver rebounded from 21st to fourth place this quarter as supply shortages reignited price growth. The 15% foreign buyer tax has influenced luxury prices more than the mainstream market but with a raft of new cooling measures announced following February’s Budget the city may yet see its rate of growth soften.
Notes: *Asking prices **Provisional ***Metropolitan area. All data corresponds to 12-month percentage change to Q4 2017 except: Brussels, Bucharest, Budapest, Kuala Lumpur, Lille, Limassol, Lyon, Marseille, Nicosia, Sofia, Zagreb which is to Q3 2017 and Santiago which is to Q2 2017. Data for United Kingdom as at 29th March 2018.
Courtesy: Knight Frank

Sources: Knight Frank Research; Macrobond; Bank for International Settlements; Australian Bureau of Statistics; OeNB; Statbel; Bulgarian National Statistical Institute; FIPE; Teranet-National Bank House Price Index™. Reproduced and distributed on an “as is” basis with the permission of Teranet Inc. and National Bank of Canada; Central Bank of Chile; China National Bureau of Statistics (NBS); Colombian National Administrative Department of Statistics (DANE); Croatian Bureau of Statistics; Central Bank of Cyprus; Statistics Denmark; Statistics Estonia; Statistics Finland; INSEE; ImmobilienScout24; Bank of Greece; Hong Kong Ratings and Valuation Department; Hungarian Central Statistical Office; Statistics Iceland; Indian National Housing Bank (NHB); Bank of Indonesia; Irish Central Statistics Office (CSO); Israel Central Bureau of Statistics; Immobiliare Italia; Japanese Ministry of Land, Infrastructure, Transport and Tourism; Arcoreal; Macedonian Statistical Office; Malaysian Valuation & Property Services Department; Mexican Federal Mortgage Company (SHF Sociedad Hipotecaria Federal); Statistics Netherlands (CBS); Quotable Value; Statistics Norway; Central Reserve Bank of Peru; National Bank of Poland; Portuguese National Statistics Institute (INE); Romanian National Institute of Statistics; Rosstat; Singapore Urban Redevelopment Authority; Central Bank of Slovakia; Slovenian Statistical Office; First National Bank; Kookmin Bank; Spain Ministry of Development; Statistics Sweden; Swiss National Bank/Wuest+Partner; Taiwan Department of Land Administration, Taipei City Government; Central Bank of the Republic of Turkey (TCMB); REIDIN; Blagovest; HM Land Registry; S&P CoreLogic Case Shiller
RESIDENTIAL RESEARCH
Liam Bailey - Global Head of Research
+44 20 7861 5133
Kate Everett-Allen - International Residential Research
+44 20 7167 2497
PRESS OFFICE
Astrid Recaldin - International PR Manager
+44 20 7861 1182
Important Notice © Knight Frank LLP 2018 – This report is published for general information only and not to be relied upon in any way. Although high standards have been used in the preparation of the information, analysis, views and projections presented in this report, no responsibility or liability whatsoever can be accepted by Knight Frank LLP for any loss or damage resultant from any use of, reliance on or reference to the contents of this document. As a general report, this material does not necessarily represent the view of Knight Frank LLP in relation to particular properties or projects. Reproduction of this report in whole or in part is not allowed without prior written approval of Knight Frank LLP to the form and content within which it appears. Knight Frank LLP is a limited liability partnership registered in England with registered number OC305934. Our registered office is 55 Baker Street, London, W1U 8AN, where you may look at a list of members’ names.

© 2005 - 2026 | Portfolio Property Investments | Powered by the PPI Business Platform