


Results for Q1 2018
SEOUL LEADS LUXURY HOUSE PRICE RANKINGS
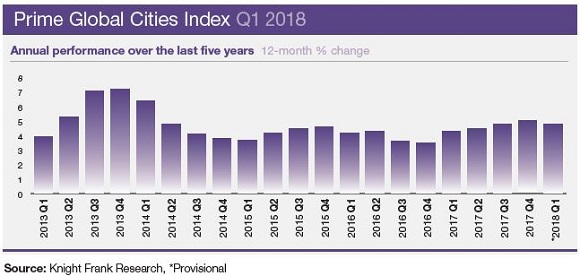
Our Q1 2018 index represents the first update since our Wealth Report analysis and is a valuable means of gauging where luxury prices are headed at a time when, despite the global economy being in robust health, there are significant risks ahead in the form of rising debt, inflation, and greater housing market regulation.
The index increased by 4.8% in the year to March 2018, marginally lower than the 4.9% in December 2017. As borrowing costs start to increase across some of the world’s major economies we expect prime price growth to moderate further. Already, the gap between the strongest and weakest-performing city has slipped from 39% to 33% in the last three months and the number of cities that saw their rate of annual growth decline has risen from 16 to 23 over the same three-month period.
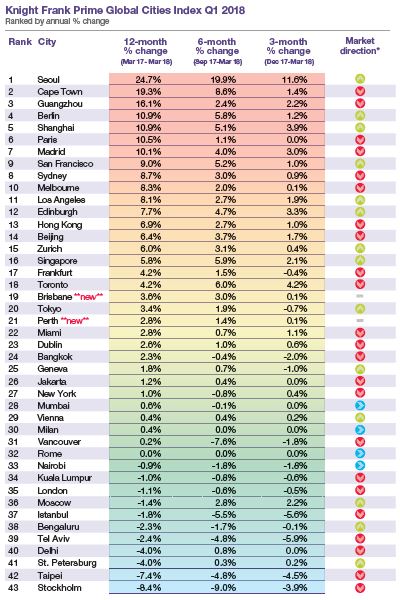
Seoul has overtaken Guangzhou this quarter, registering 24.7% annual growth. Across a large part of the city new macro prudential measures, including new taxes for owners of multiple properties and tighter lending restrictions, are cooling growth, but the prime area of Gangnam is still seeing strong speculative activity.
Cape Town continues to occupy second position in the rankings with prices ending the year to March 19.3% higher. Although the wider city market is cooling, a lack of supply in the prime areas we track in Camps Bay, Bantry Bay and the Atlantic Seaboard is pushing prices higher.
Cities in Asia Pacific now account for five of the top ten rankings. Key European cities are also well-represented at the top of the table. Edinburgh and Zurich join Berlin, Paris and Madrid in the top 15 this quarter.
Prime residential prices in the Scottish capital accelerated 7.7% in the 12 months to March 2018. A demand-supply imbalance is underpinning values with sales above £500,000 increasing 16% in 2017.
Sydney (8.7%) and Melbourne (8.3%), are following a similar narrative with supply constraints supporting prime prices. Both cities continue to outpace their Australian counterparts, Brisbane (3.6%) and Perth (2.8%) which we are tracking for the first time this quarter.
The world’s top tier cities – London, New York and Hong Kong – all saw annual price growth dip marginally compared with last quarter. In London, while the market remains sensitive to political events there is a sense of (relative) stability being restored.
In New York the weaker dollar is attracting foreign interest and with Wall Street bonuses back to pre-crisis levels we expect luxury demand to strengthen.
In Hong Kong prime prices accelerated 6.9% although mainstream prices continue to outperform. Despite China’s capital controls there remains a strong appetite for USDpegged assets from the Chinese Mainland.
At the bottom of the table, Moscow no longer holds the title of weakest-performing market. Instead, Stockholm (-8.4%), Taipei (-7.4%) and St Petersburg (-4.0%) registered the largest prime price declines over the 12-month period.
Source: All data comes from Knight Frank’s global network with the exception of Tokyo (Ken Corporation); New York (StreetEasy); Los Angeles, Miami and San Francisco (S&P CoreLogic Case-Shiller); Tel Aviv (Israel Central Bureau of Statistics); Berlin and Frankfurt (Immobilienscout 24); Stockholm (Svensk Maklarstatistik); Toronto (Real Estate Board of Toronto); Vancouver (Vancouver Real Estate Board); Zurich and Geneva (Wüest Partner).
Notes: Price change calculated in local currency. Data for Tel Aviv is to Q4 2017, data for Los Angeles, Miami and San Francisco is to February 2018.
¹ Based on top-tier of mainstream market in metro area. ² Based on all contracts above Yen100m 3 Provisional
*Direction of annual price growth compared with previous quarter
Courtesy: Knight Frank

DATA DIGEST
The Knight Frank Prime Global Cities Index enables investors and developers to monitor and compare the performance of prime residential prices across key global cities. Prime property corresponds to the top 5% of the housing market in each city, unless otherwise indicated. The index is compiled on a quarterly basis using data from Knight Frank’s network of global offices and research teams
RESIDENTIAL RESEARCH
Liam Bailey - Global Head of Research
+44 20 7861 5133
Kate Everett-Allen - International Residential Research
+44 207 167 2497
PRESS OFFICE
Astrid Recaldin
+44 20 7861 1182
Important Notice
© Knight Frank LLP 2018 – This report is published for general information only and not to be relied upon in any way. Although high standards have been used in the preparation of the information, analysis, views and projections presented in this report, no responsibility or liability whatsoever can be accepted by Knight Frank LLP for any loss or damage resultant from any use of, reliance on or reference to the contents of this document. As a general report, this material does not necessarily represent the view of Knight Frank LLP in relation to particular properties or projects. Reproduction of this report in whole or in part is not allowed without prior written approval of Knight Frank LLP to the form and content within which it appears. Knight Frank LLP is a limited liability partnership registered in England with registered number OC305934. Our registered office is 55 Baker Street, London, W1U 8AN, where you may look at a list of members’ names.

© 2005 - 2026 | Portfolio Property Investments | Powered by the PPI Business Platform