


GLOBAL CITIES UPDATE
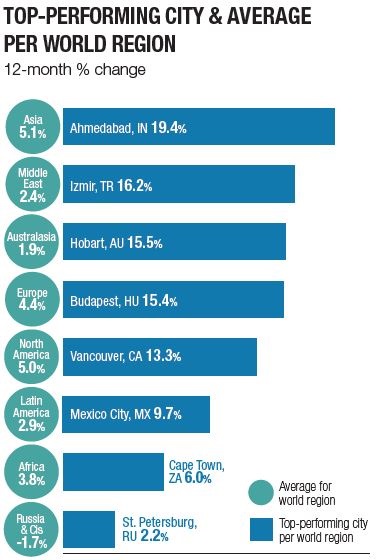
Indian cities occupy three of the top ten rankings for annual growth in the year to June 2018
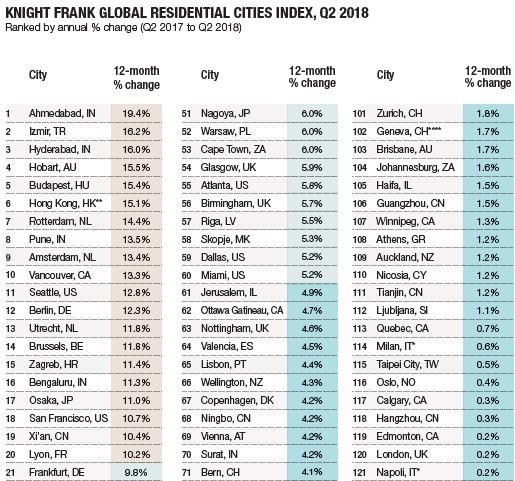
Q2 2018 RESULTS
KNIGHT FRANK’S GLOBAL RESIDENTIAL CITIES INDEX TRACKS THE MOVEMENT IN MAINSTREAM RESIDENTIAL PRICES ACROSS 150 CITIES WORLDWIDE USING OFFICIAL GOVERNMENT STATISTICS OR CENTRAL BANK DATA.
The average value of a property in 150 cities worldwide increased by 4.3% in the year to June 2018, according to the Knight Frank Global Residential Cities Index.
The Indian city of Ahmedabad leads the annual rankings this quarter, registering a 19% rise. Two other Indian cities also made the top ten this quarter, Hyderabad (16%) and Pune (14%). According to government data the Indian economy grew by 8.2% in the year to Q1 2018 and this is filtering through to housing demand and consumer confidence.
Budapest (15%), Rotterdam (14%) and Amsterdam (13%) are Europe’s frontrunners.
Domestic and international buyers alike have recognised Budapest’s comparative value whilst Dutch house prices, which were falling up until 2013, have undergone a sharp correction.
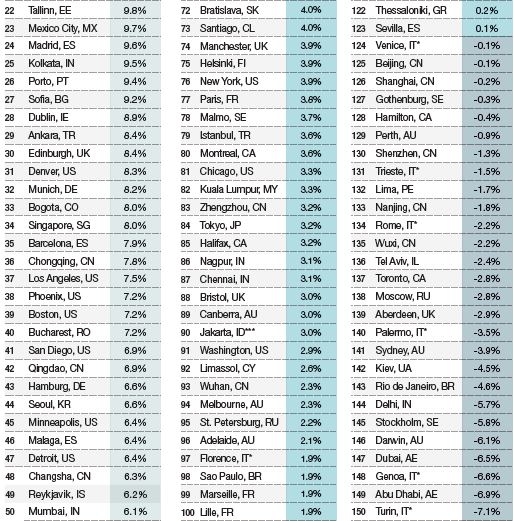
Of the 150 cities monitored, 123 (82%) recorded a rise in residential prices during the year to June.
Asia is the strongest-performing world region, on average prices ended the year to June 5.1% higher across the Asian cities tracked. In second place was North America registering 5% growth.
Long-term strong performer, Hong Kong, registered a marginal slowdown in annual growth although prices in the year to June still accelerated 15%. At the end of September, Hong Kong’s banks raised prime rates for the first time in 12 years, which is feeding through into mortgage payments, influencing Hong Kong borrowers.
Of those countries where a rate rise has taken place in 2018, a number have a significant gap between their strongest and weakest performing city (16% in Canada, 11% UK, 10% US). With some already registering negative annual growth, we expect any further tightening of monetary policy to be slow and steady.
In some cities, the performance of the mainstream and prime market is diverging. A lack of prime supply is cushioning the top segment of the market in Sydney and Dubai where annual prime price growth is closer to 5.7% and -0.8% respectively. Elsewhere, tax changes targeting foreign buyers or higher stamp duty (Vancouver, Toronto, Hong Kong) has led to slower growth at the luxury end of the market.
Notes: *Asking prices **Provisional *** Metropolitan area ****Lake Geneva. Spanish data relates to the city-region.
AE United Arab Emirates, AT Austria, AU Australia, BE Belgium, BG Bulgaria, CA Canada, CH Switzerland, CL Chile, CN China, CO Colombia, CY Cyprus, CZ Czech Republic, DK Denmark, EE Estonia, ES Spain, FI Finland, FR France, GR Greece, HK Hong Kong, HR Croatia, HU Hungary, IE Ireland, IL Israel, IN India, IS Iceland, IT Italy, JP Japan, KR South Korea, LV Latvia, MK Macedonia, MX Mexico, MY Malaysia, PE Peru, NL Netherlands, NO Norway, NZ New Zealand, PT Portugal, RU Russia, SE Sweden, SG Singapore, SI Slovenia, SK Slovakia, TR Turkey, TW Taiwan, UK United Kingdom, US United States, ZA South Africa
All data corresponds to 12-month percentage change to Q2 2018 except: Brussels, Bucharest, Budapest, Cape Town, Florence, Genoa, Johannesburg, Kuala Lumpur, Lille, Limassol, Ljubljana, Lyon, Marseille, Milan, Nagoya, Napoli, Osaka, Palermo, Rome, Tokyo, Trieste, Turin, Venice, Warsaw and Zagreb which is to Q1 2018. Data for Geneva, Haifa, Jerusalem, Santiago, Sofia, Tel Aviv which is Q4 2017.
Sources: Knight Frank Research; Macrobond; Bank for International Settlements; Australian Bureau of Statistics; OeNB; Statbel; Bulgarian National Statistical Institute; FIPE; Teranet-National Bank House Price Index™. Reproduced and distributed on an “as is” basis with the permission of Teranet Inc. and National Bank of Canada; Central Bank of Chile; China National Bureau of Statistics (NBS); Colombian National Administrative Department of Statistics (DANE); Croatian Bureau of Statistics; Central Bank of Cyprus; Statistics Denmark; Statistics Estonia; Statistics Finland; INSEE; ImmobilienScout24; Bank of Greece; Hong Kong Ratings and Valuation Department; Hungarian Central Statistical Office; Statistics Iceland; Indian National Housing Bank (NHB); Bank of Indonesia; Irish Central Statistics Office (CSO); Israel Central Bureau of Statistics; Immobiliare Italia; Japanese Ministry of Land, Infrastructure, Transport and Tourism; Arcoreal; Macedonian Statistical Office; Malaysian Valuation & Property Services Department; Mexican Federal Mortgage Company (SHF Sociedad Hipotecaria Federal); Statistics Netherlands (CBS); Quotable Value; Statistics Norway; Central Reserve Bank of Peru; National Bank of Poland; Portuguese National Statistics Institute (INE); Romanian National Institute of Statistics; Rosstat; Singapore Urban Redevelopment Authority; Central Bank of Slovakia; Slovenian Statistical Office; First National Bank; Kookmin Bank; Spain Ministry of Development; Statistics Sweden; Swiss National Bank/Wuest+Partner; Taiwan Department of Land Administration, Taipei City Government; Central Bank of the Republic of Turkey (TCMB); REIDIN; Blagovest; HM Land Registry; S&P Case Shiller.
Courtesy: Knight Frank

Please contact us for further information
Sales enquiries - Mark Harvey
+44 20 7861 5034
Research enquiries: - Kate Everett-Allen
+44 20 7167 2497
Important Notice. © Knight Frank LLP 2018 – This report is published for general information only and not to be relied upon in any way. Although high standards have been used in the preparation of the information, analysis, views and projections presented in this report, no responsibility or liability whatsoever can be accepted by Knight Frank LLP for any loss or damage resultant from any use of, reliance on or reference to the contents of this document. As a general report, this material does not necessarily represent the view of Knight Frank LLP in relation to particular properties or projects. Reproduction of this report in whole or in part is not allowed without prior written approval of Knight Frank LLP to the form and content within which it appears. Knight Frank LLP is a limited liability partnership registered in England with registered number OC305934. Our registered office is 55 Baker Street, London, W1U 8AN, where you may look at a list of members’ names.

© 2005 - 2026 | Portfolio Property Investments | Powered by the PPI Business Platform