


Average house price dips for the first time since January as stamp duty holiday winds down
Russell Galley, Managing Director, Halifax, said:
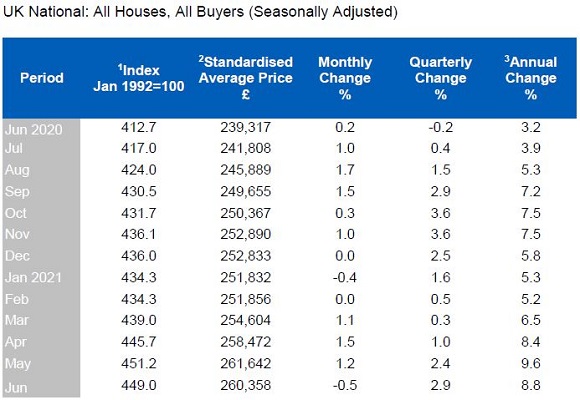
“The average UK house price slipped by -0.5% in June, the first monthly fall since January. As a result annual house price inflation also eased back slightly from May’s 14-year high of +9.6% to stand at +8.8% in June. It is important to put such a moderate decrease in context, with average prices still more than £21,000 higher than this time last year, following a broadly unprecedented period of gains.
“With the stamp duty holiday now being phased out, it was predicted the market might start to lose some steam entering the latter half of the year, and it’s unlikely that those with mortgages approved in the early months of summer expected to benefit from the maximum tax break, given the time needed to complete transactions.
“That said, with the tapered approach, those purchasing at the current average price of £260,358 would still only pay about £500 in stamp duty at today’s rates, increasing to around £3,000 when things return to normal from the start of October.
“Government support measures over the last year have helped to boost demand, particularly amongst buyers searching for larger family homes at the upper end of the market. Indeed, the average price of a detached home has risen faster than any other property type over the past 12 months, up by more than 10% or almost £47,000 in cash terms. At a cost of over half a million pounds, they are now £200,000 more expensive than the typical semi-detached house.
“That power of homemovers to drive the market, as people look to find properties with more space, spurred on by increased time spent at home during the pandemic, won’t fade entirely as the economy recovers. Coupled with buyers chasing the relatively small number of available properties, and continued low borrowing rates, it’s a trend which can sustain high average prices for some time to come.
“However, we would still expect annual growth to have slowed somewhat more by the end of the year, with unemployment expected to edge higher as job support measures unwind, and the peak of buyer demand now likely to have passed.”
Regions and nations house prices
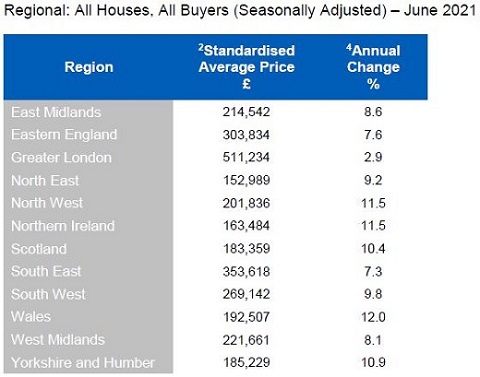
Whilst the two Midlands regions and Greater London saw slightly slower annual price gains compared to May, all the other regions and nations saw a strengthening of inflation.
Wales (12.0%) continues to lead the way on annual house price growth, registering its strongest performance since April 2005, whilst Northern Ireland (11.5%), the North West (11.5%), Yorkshire and Humberside (10.9%) and Scotland (10.4%) all registered double-digit gains.
For Northern Ireland and Scotland, the annual price rises were the highest recorded since late 2007, while for the North West and Yorkshire, inflation was the strongest since early 2005.
At the other end of the scale, the South of England continues to lag somewhat behind the rest of the country (Eastern England and the South East recording inflation rates of around 7%).
However, once again its Greater London that is somewhat of an outlier: house price inflation there was just 2.9% year-on-year, though as we’ve noted previously, there are several unique factors likely to be weighing on the capital’s property market.
KEY FACTS
Housing activity
UK HOUSE PRICES HISTORICAL DATA
Editors' notes
House price data on a quarterly basis provides the clearest indication of overall market trends, smoothing out the monthly volatility caused by the reduced number of monthly transactions used to calculate all house price indices.
1. Index
The standardised index is seasonally adjusted using the U.S. Bureau of the Census X-11 moving-average method based on a rolling 84-month series. Each month, the seasonally adjusted figure for the same month a year ago and last month's figure are subject to revision.
2. Standardised average price
The standardised average price is calculated using the HPI’s mix adjusted methodology.
3. National annual change figure
National annual change figures are the seasonally adjusted year-on-year figures.
4. Regional annual change figure
The regional annual change figures are based on the most recent three months of approved mortgage transaction data.
![]()
Halifax press office contacts:
Gregor Low / 07500 078 879 / [email protected]
About the Halifax house price index
The Halifax House Price Index is the UK's longest running monthly house price series with data covering the whole country going back to January 1983. From this data, a "standardised" house price is calculated and property price movements on a like-for-like basis (including seasonal adjustments) are analysed over time. The annual change figure is calculated by comparing the current month non-seasonally adjusted figure with the same month a year earlier.
For more information on our housing market research, visit http://www.halifax.co.uk/house-price-index
About IHS Markit (www.ihsmarkit.com)
IHS Markit (NYSE: INFO) is a world leader in critical information, analytics and solutions for the major industries and markets that drive economies worldwide. The company delivers next-generation information, analytics and solutions to customers in business, finance and government, improving their operational efficiency and providing deep insights that lead to well-informed, confident decisions. IHS Markit has more than 50,000 business and government customers, including 80 percent of the Fortune Global 500 and the world’s leading financial institutions.
IHS Markit is a registered trademark of IHS Markit Ltd. and/or its affiliates. All other company and product names may be trademarks of their respective owners © 2020 IHS Markit Ltd. All rights reserved.
The intellectual property rights to the Halifax House Price Index (the “Index”) provided herein is owned by IHS Markit. The use of the Halifax name and logo on the Index by IHS Markit is under licence from Lloyds Banking Group and its affiliates. IHS Markit and the IHS Markit logo are registered trade marks of IHS Markit Ltd.
Any unauthorised use, including but not limited to copying, distributing, transmitting or otherwise of any data appearing is not permitted without IHS Markit’s prior consent. IHS Markit shall not have any liability, duty or obligation for or relating to the content or information (“data”) contained herein, any errors, inaccuracies, omissions or delays in the data, or for any actions taken in reliance thereon. In no event shall IHS Markit be liable for any special, incidental, or consequential damages, arising out of the use of the data. For the avoidance of doubt, the Index and the data cannot be used as a “benchmark” under the Principles for Financial Benchmarks published by the International Organization Of Securities Commissions in July, 2013 or the European Union Regulation for Financial Benchmarks any other similar or comparable framework, principles, guidelines, rules, regulations or laws governing the administration of, submission of data to or the management of benchmarks and indices, including for the purposes of measuring the performance of a financial instrument or determining the interest payable, or other sums due under financial contracts or financial instruments or determining their value or the price at which they be bought, sold, traded or redeemed. A licence from IHS Markit is required for benchmark and all other uses of the Halifax House Price Index.
Courtesy: Knight Frank

CONTACT DETAILS FOR FURTHER INFORMATION:
Hannah Morris - Residential Development PR Manager
55 Baker Street, London, U1U 8AN, United Kingdom
T: ++44 20 7861 1364
S: ++44 20 7629 8171
M: ++44 7814 294 299
Email: [email protected]
Website: knightfrank.com

© 2005 - 2026 | Portfolio Property Investments | Powered by the PPI Business Platform